Our research method in practice
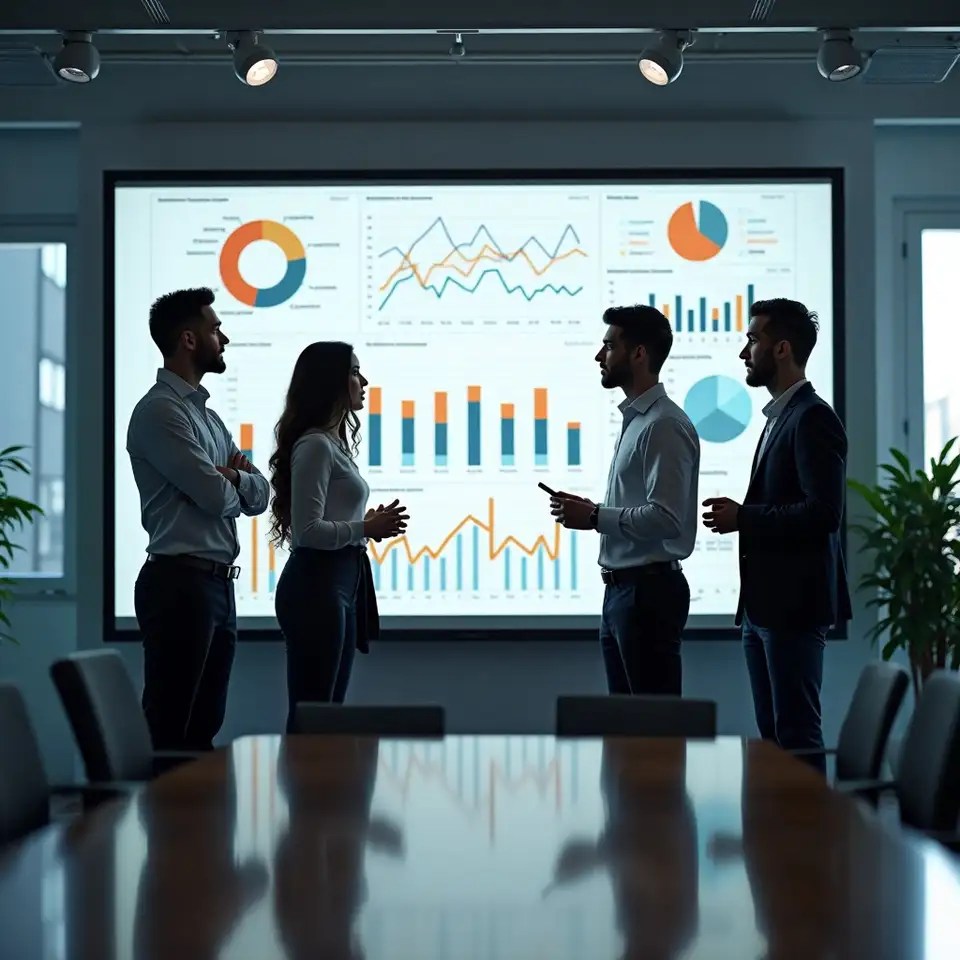
We have all seen a chart that looked convincing until we asked how it was built. At Queloristan, we treat that question as the starting point, not an afterthought. Our AI driven cross market lead lag detection begins with a clear research question, such as how a regional index has tended to move relative to a broader benchmark or how a sector reference might react after a macro indicator shifts. We then apply time series models that scan historical data for potential lead relationships and estimate typical lag ranges. These models highlight where one series appears to move ahead of another more often than chance might suggest, while also revealing periods where that relationship weakens or reverses. We run stress checks across different windows, parameter settings, and reference choices to see how sensitive the patterns are. When we present results, we pair charts with short narratives that explain what was tested, what appeared, and where uncertainty is highest. This information is designed for mixed technical and business audiences, so that quants, analysts, and leaders can share a common view while still applying their own judgement. Our work remains research oriented. We do not provide personal advice, and we remind users that results may vary and that past performance does not guarantee future results.

Why this page
A practical guide to understanding our AI based cross market lead lag analysis, from raw data through to narratives your team can discuss and challenge together.
We have all misread a move by looking at one chart in isolation. Our information hub
exists to give you a fuller picture of how we study cross market lead lag effects, from
data inputs to interpretation. Here you can explore how our AI tools search for timing
relationships, how we stress test those patterns, and how we communicate uncertainty in
plain language for mixed teams. Use this section as a companion to your own internal
frameworks and professional advice, not as a replacement for them. Results may vary, and
past performance does not guarantee future results.
Ask us
How Queloristan approaches AI lead lag research
We have all opened a new tool and wondered what it really does beneath the surface.
This page collects key information about how Queloristan approaches AI driven cross
market lead lag detection, which teams typically use it, and what limits we keep
front and centre. We describe our research focus, our internal methods, and how our
analysis fits into broader financial market workflows. Throughout, we emphasise that
our content is informational, results may vary, and past performance does not
guarantee future results.
Use this page as a reference when you need more context than a headline or product
label can provide. If you still have questions after reading, you can reach out
through our contact page to discuss specific scenarios, governance concerns, or data
requirements in more detail.

How teams typically use the information we provide
These examples show how our AI driven lead lag insights act as a supporting lens for research, risk, and leadership conversations, rather than as a standalone decision engine or personal roadmap.
We have all skimmed an information page and missed the one line that mattered most. This section pulls together a few narrative explanations of how our AI based cross market lead lag research fits into real workflows, what it can help with, and where it stops.
Imagine a research team preparing a weekly briefing. In the past, each analyst
brought separate charts on different markets, and the group spent half the meeting
aligning timelines. With our cross market lead lag analysis, they start from a
shared view that shows which indices have tended to move first, typical lag ranges,
and how those relationships have behaved across recent periods. The discussion then
shifts from arguing about basic facts to exploring scenarios and caveats. Our role
is to provide that shared reference, not to dictate decisions.
Consider a risk group reviewing how quickly internal indicators respond to external
moves. They might use our information to see where a benchmark often reacts after a
regional or sector reference, and how long that delay has typically been. This does
not tell them what to change, but it gives them a structured basis for questions
about monitoring thresholds, alert timing, and escalation paths. They still rely on
their own frameworks, regulators, and professional advisors. We simply add another
layer of context about cross market dynamics.
Now think of a leadership team that needs a concise story before a major review.
They do not have time to read every chart, but they do need to understand how
markets have been moving together or drifting apart. Our narrative summaries
condense complex AI outputs into short descriptions of potential lead lag patterns,
their stability, and their limits. We emphasise that results may vary and that past
performance does not guarantee future results, so that leaders treat our material as
background research rather than a forecast or promise.
How this information fits with privacy and cookies
This overview does not replace our formal privacy and cookie notices, but it gives a
practical sense of how information on this site supports both our research work and your
ability to stay in control.
We have all wondered what happens to our data when we interact with a research site. While our full privacy policy holds the formal details, this section summarises how information on Queloristan fits into a broader trust framework.
When you browse our site, we may collect technical information such as device type,
browser, and aggregated usage patterns. We use this to understand which pages about AI
lead lag research are most helpful and where visitors struggle to find answers. Some of
this relies on cookies or similar tools, which we describe in more depth in our cookie
policy. You can usually adjust your browser settings to manage non essential cookies,
though some features may work less smoothly if you do.
If you choose to contact us, we will ask for details such as your name, contact
information, and the markets or topics you want to discuss. We use this information to
respond to your enquiry, manage follow up, and improve how we describe our services. We
do not treat contact form submissions as permission to send unrelated messages, and you
can ask us to update or remove your details where applicable law allows. For full
information on rights and retention, please refer to our privacy policy.
Across all of this, we keep a simple principle in mind. The same care we bring to
describing uncertainty in cross market lead lag analysis, we try to bring to explaining
how we handle information about you. We avoid over claiming, we document our practices,
and we update our notices as our tools and obligations evolve. Results may vary, and
rules can differ by region, so we encourage you to review our privacy and cookie
policies in full and to seek professional advice if you have specific legal questions.
Information in action
These example views show how our AI driven cross market lead lag information appears in practice, from detailed diagnostics to concise narratives for meetings.

1

2

3

4

5

6
How we structure our information
Our four frame loop
We started by watching how real teams struggled to compare moves across markets. One desk would track a regional index, another would watch a sector reference, and each would keep notes in separate tools. Our first step was to design a workflow that brought those views together. We now follow a sequence we call the four frame loop. Frame the question about potential lead lag effects. Detect candidate patterns using AI models. Stress those patterns across different periods. Explain the findings in short, clear narratives. This loop keeps our research repeatable and easier to review.
Data and diagnostics
We know that data quality shapes every insight. That is why we document which sources we use, what time ranges we cover, and how we handle gaps or anomalies. When we run cross market lead lag analysis, we align timestamps, consider trading hours, and check for structural breaks that could distort results. We then generate diagnostics that show where the models appear stable and where they are more fragile. These diagnostics are part of the information we share, so teams can weigh confidence levels alongside their own experience.

From insight to use
Information only helps if people can act on it thoughtfully. We design our outputs for mixed technical and business audiences who share responsibility for financial decisions. Charts and tables are paired with plain language explanations, caveats, and prompts for further questions. We highlight that our work is research focused, not personal advice, and that results may vary. Past performance does not guarantee future results, so we encourage users to combine our material with their own governance processes, professional guidance, and independent checks.

If you want deeper background on who we are, why we focus on cross market lead lag research, and how our values shape every analysis we publish, visit our about page for more context.
Key points about our AI lead lag information
We have all lost track of what a tool can and cannot do, especially when terms like AI
and predictive relationships are used loosely. This section outlines key points that
define how we use AI for cross market lead lag research, what you can reasonably expect
from our information, and where the boundaries sit.
Research focus, not instructions
Our work focuses on AI driven analysis of historical relationships between related markets. We look for timing patterns where one series has often moved before another, then describe those observations in clear, cautious language. These patterns are not promises or instructions. They are research findings that need to be weighed alongside other data, internal policies, and professional advice before anyone relies on them in practice.